
Dashboard and stats
Two pages for the same question: “is the swarm healthy and affordable?”
Dashboard
Section titled “Dashboard”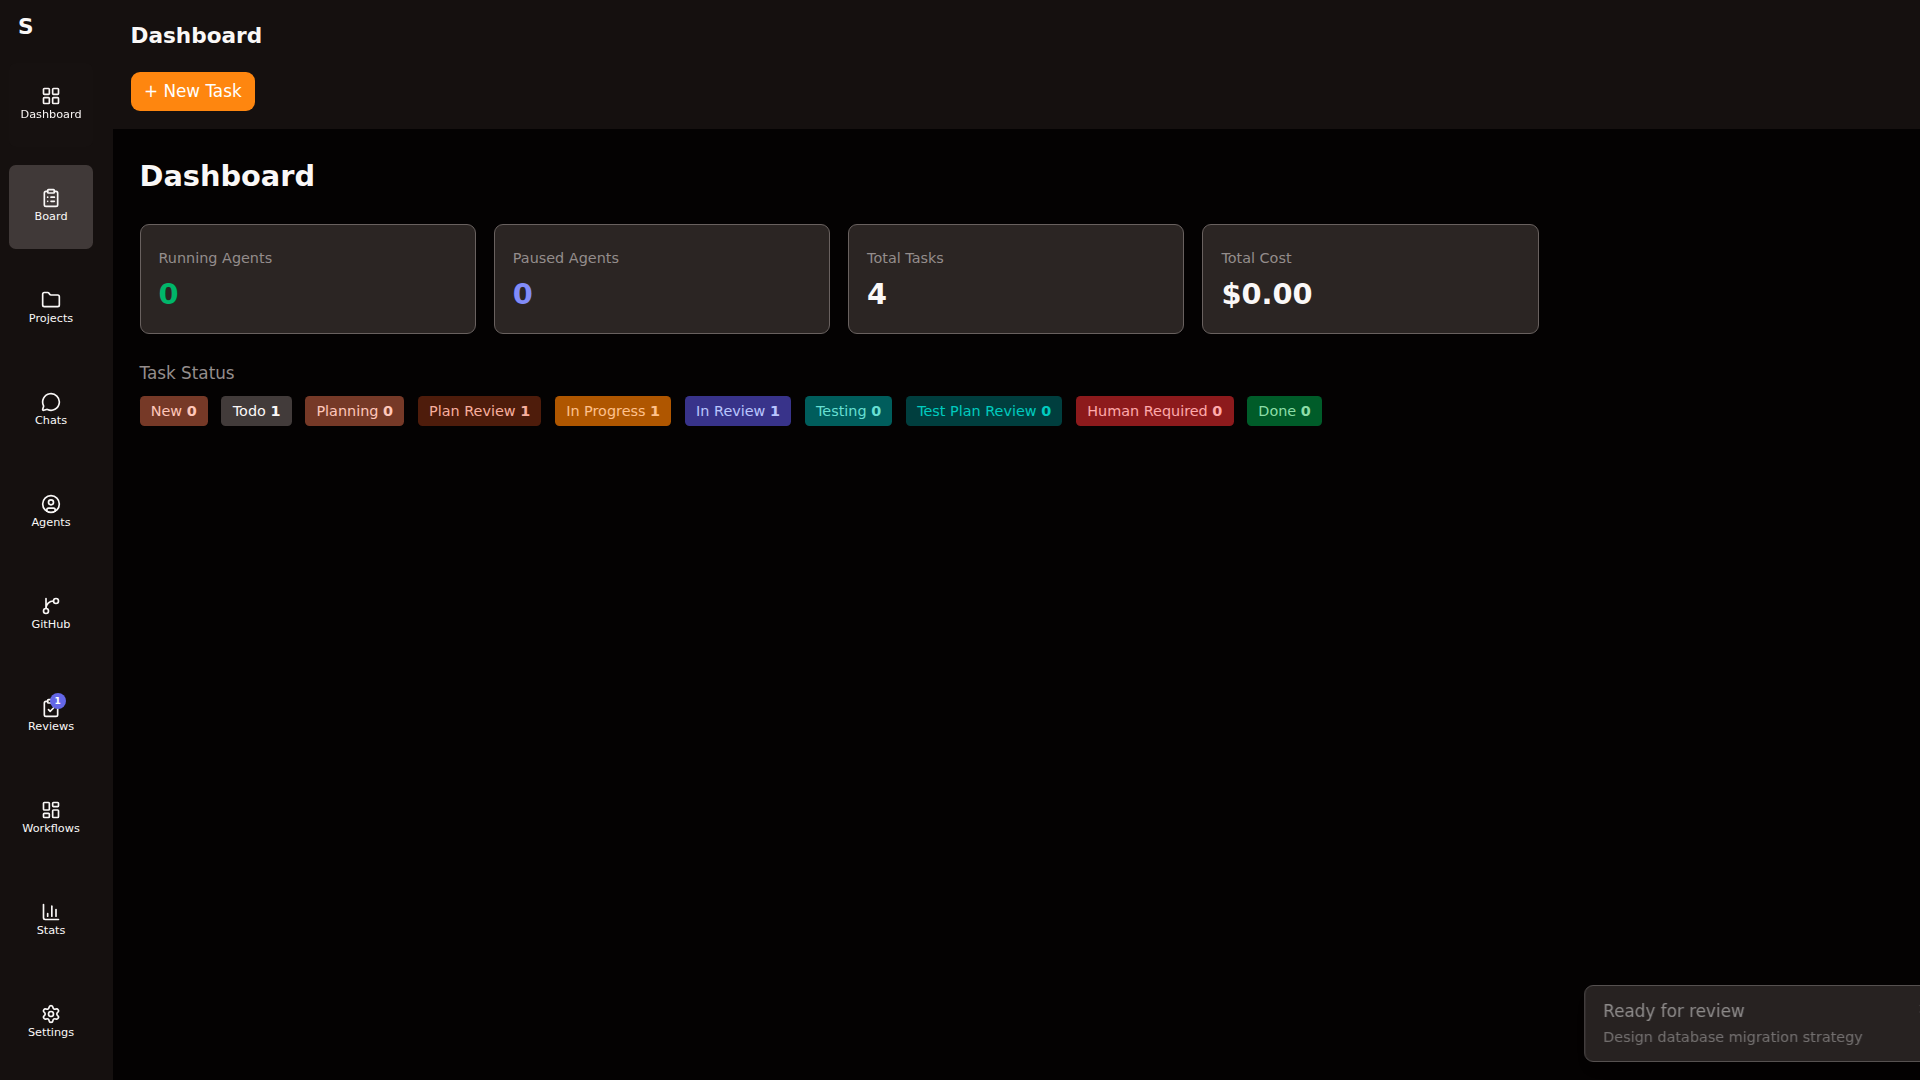
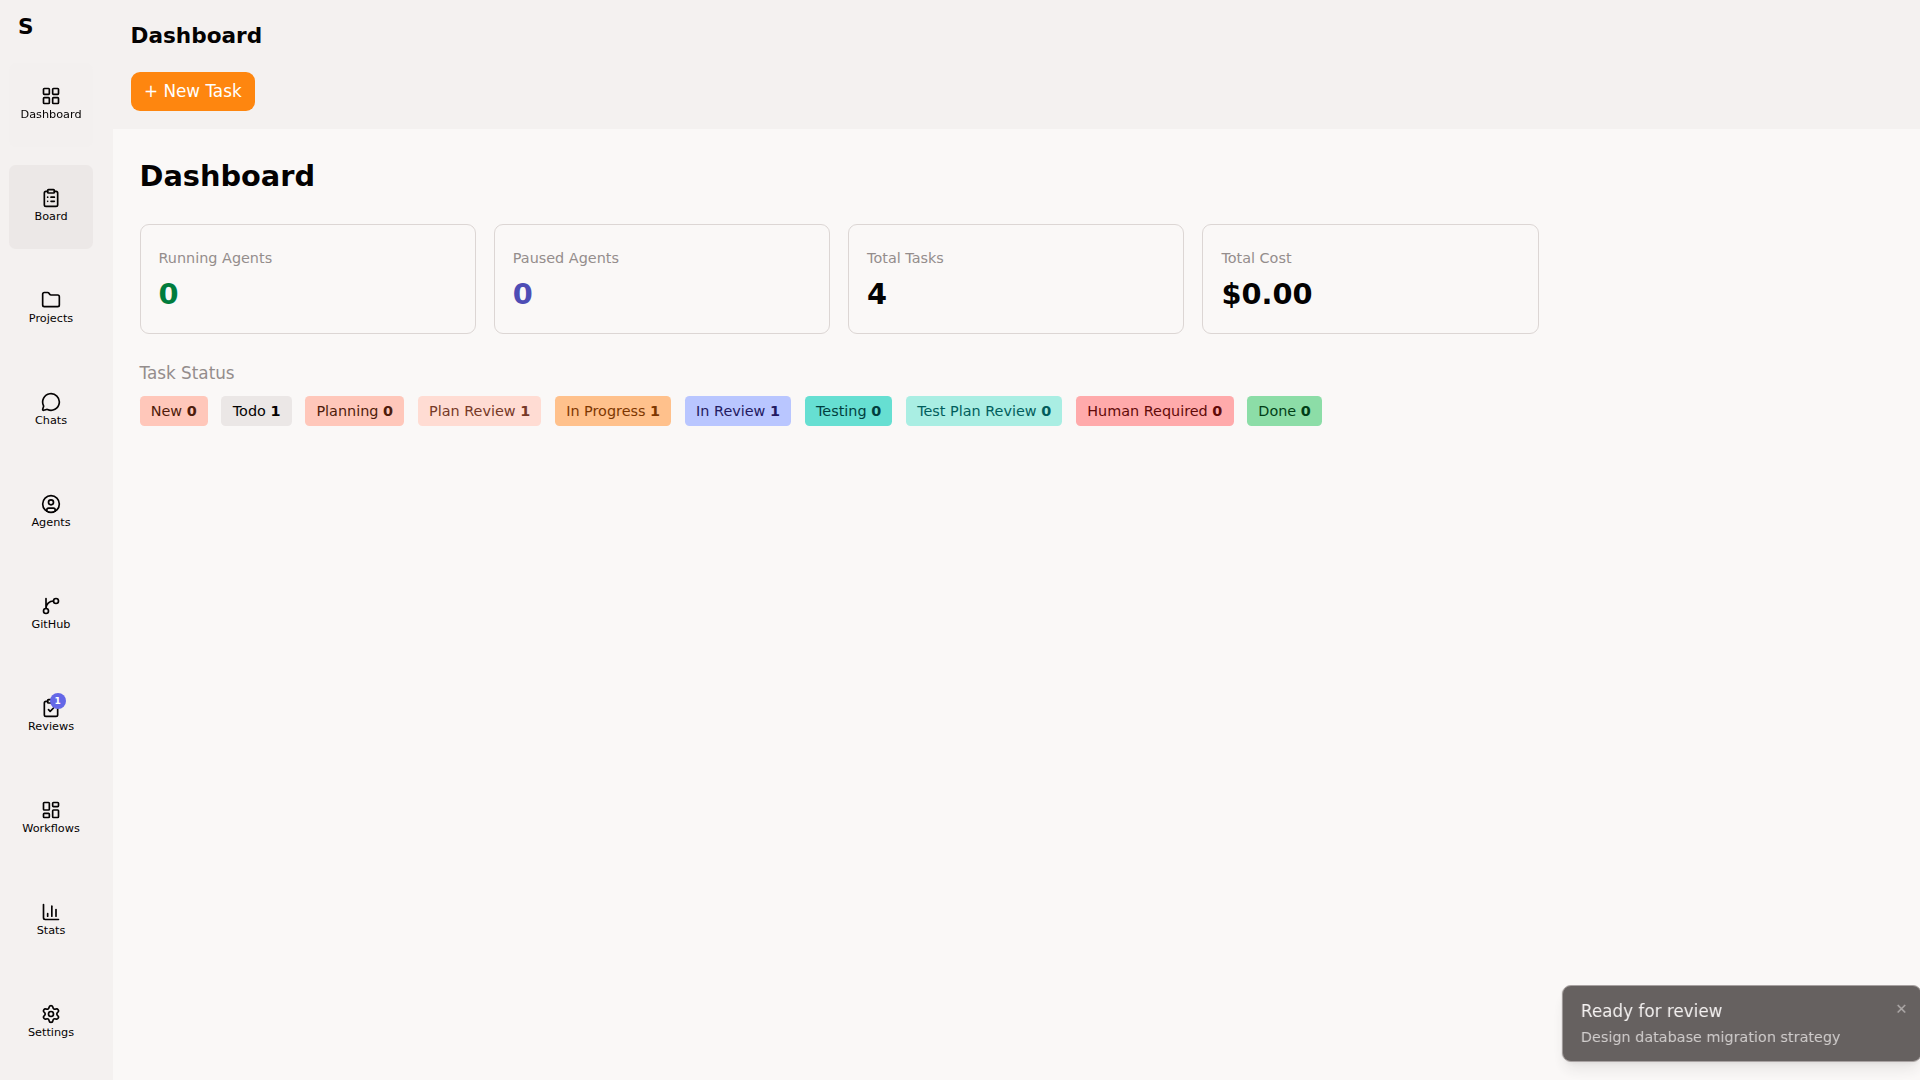
Your landing page. Shows:
- Running agents — live count, per-mode
- Task status breakdown — how many in each column
- Today’s cost — rolling 24h total across all agents
- Draft PRs — PRs waiting for you to mark ready
- Renovate PRs — count awaiting action
- Recent agent runs — last 10 completed runs with cost
Everything is clickable. Every number is a filtered view.
Signals to watch
Section titled “Signals to watch”human-requiredclimbing → the orchestrator is escalating more than usual; either a bad run of tasks or a config drift- Today’s cost spiking → check for a runaway agent on Agents page
in-reviewstatic for days → reviewers (you) are the bottleneck
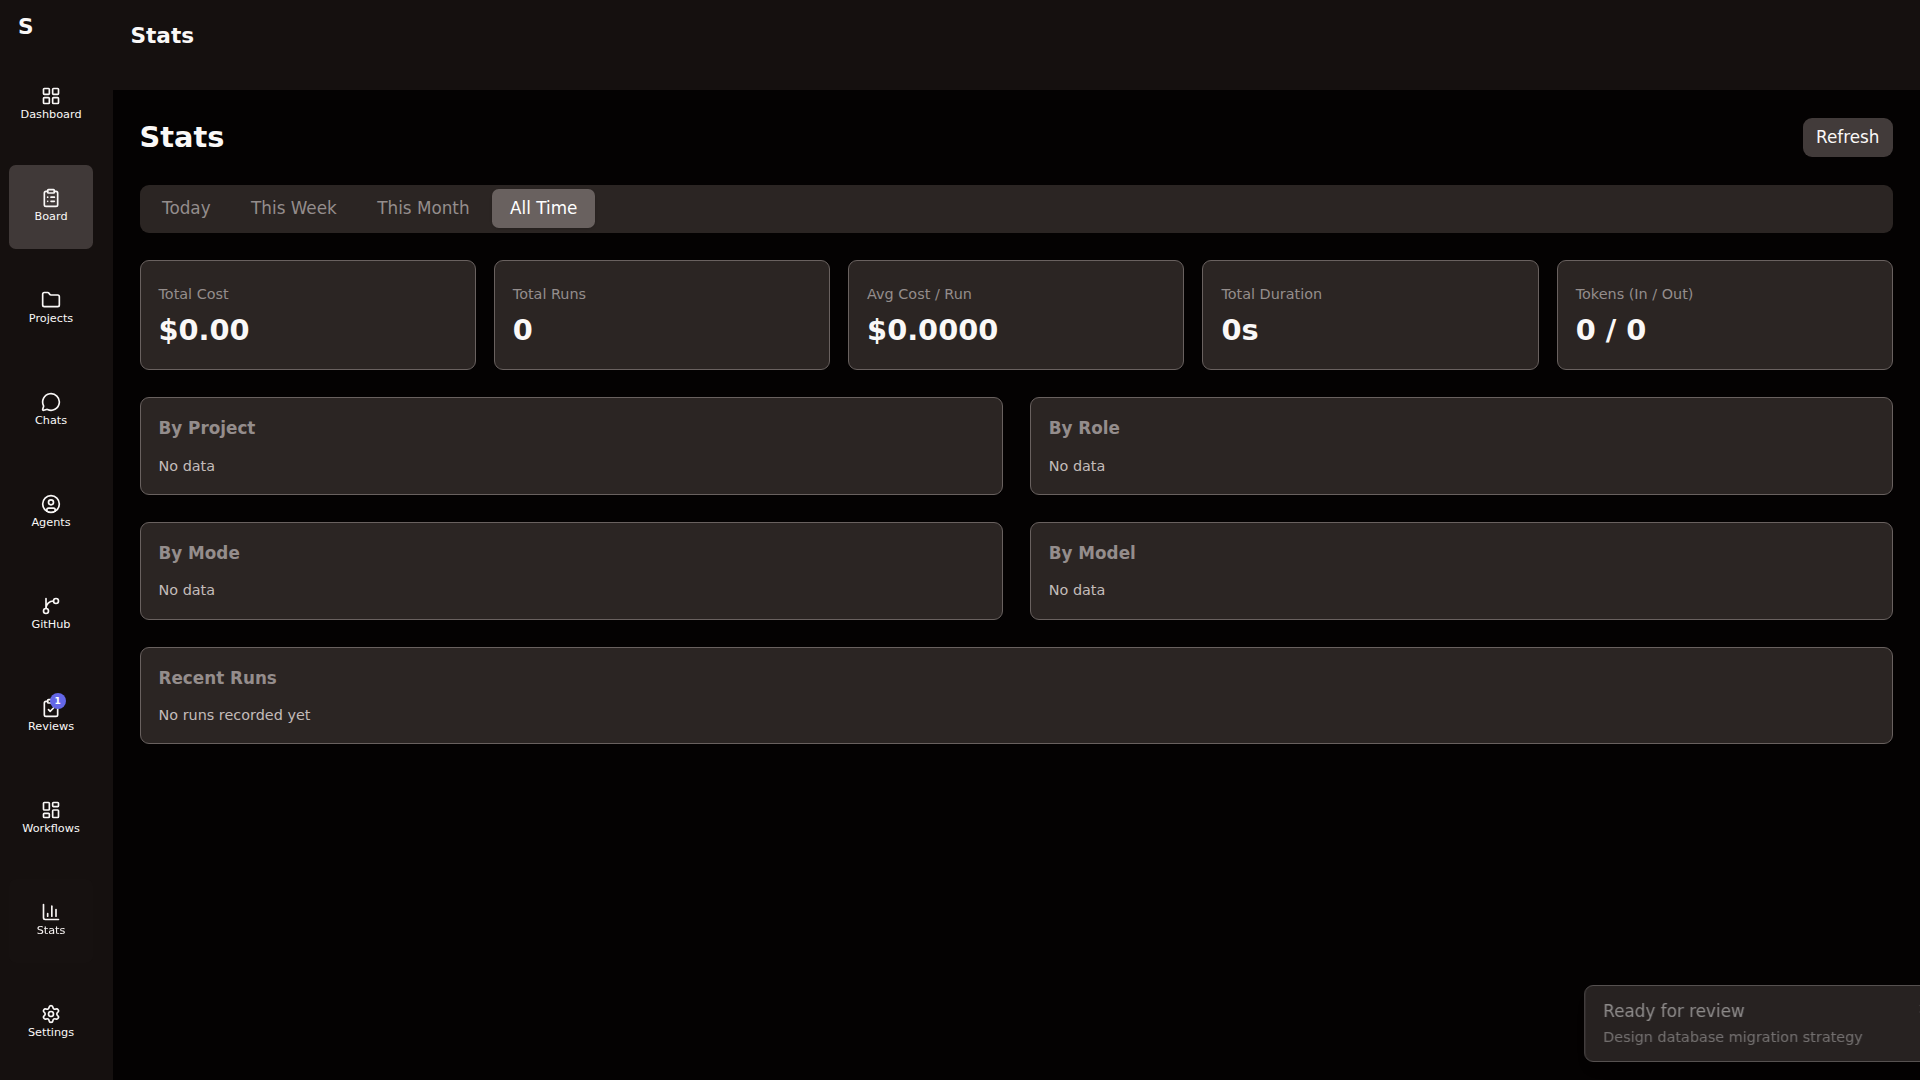
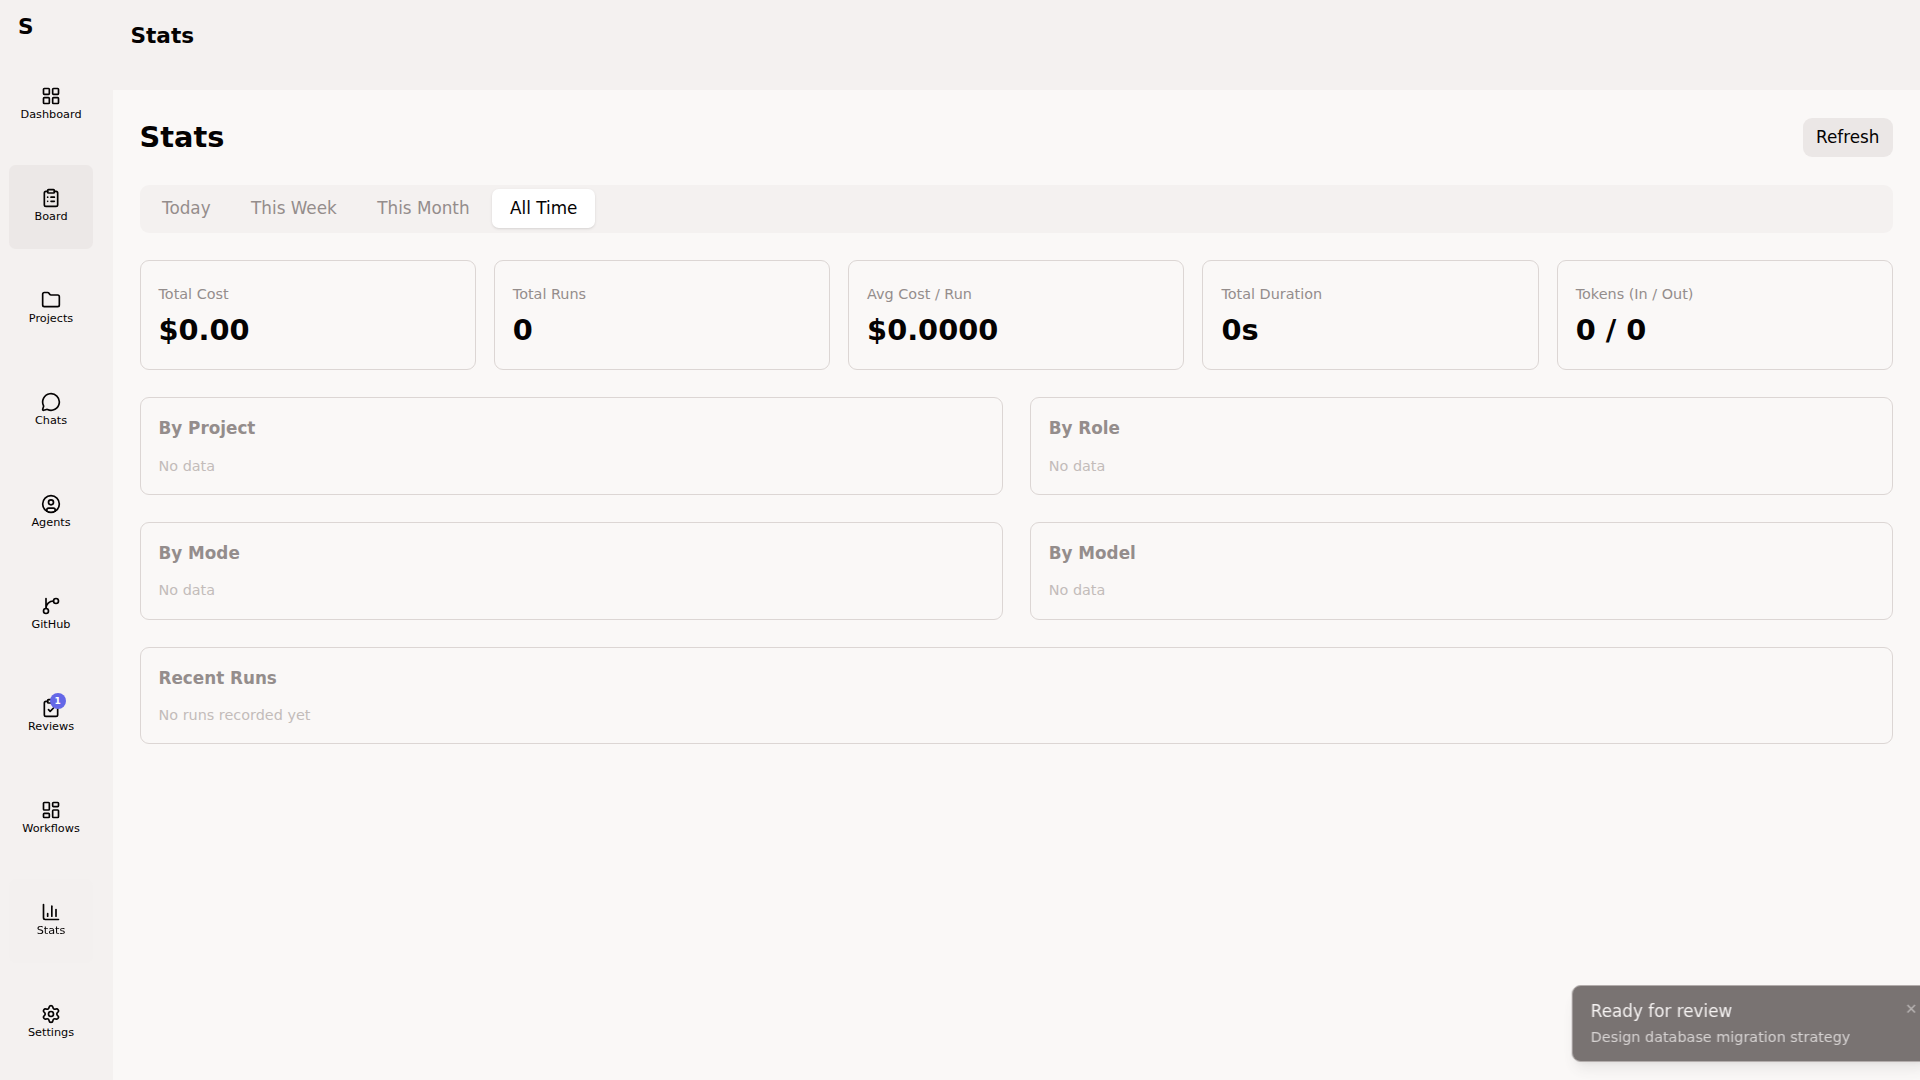
Deeper metrics. Aggregated from the audit log and stats.json.
Default view
Section titled “Default view”Running totals:
- Lifetime cost
- Total agent runs
- Pass / fail ratio
- Average cost per task
- Most expensive tasks (top 10)
This week
Section titled “This week”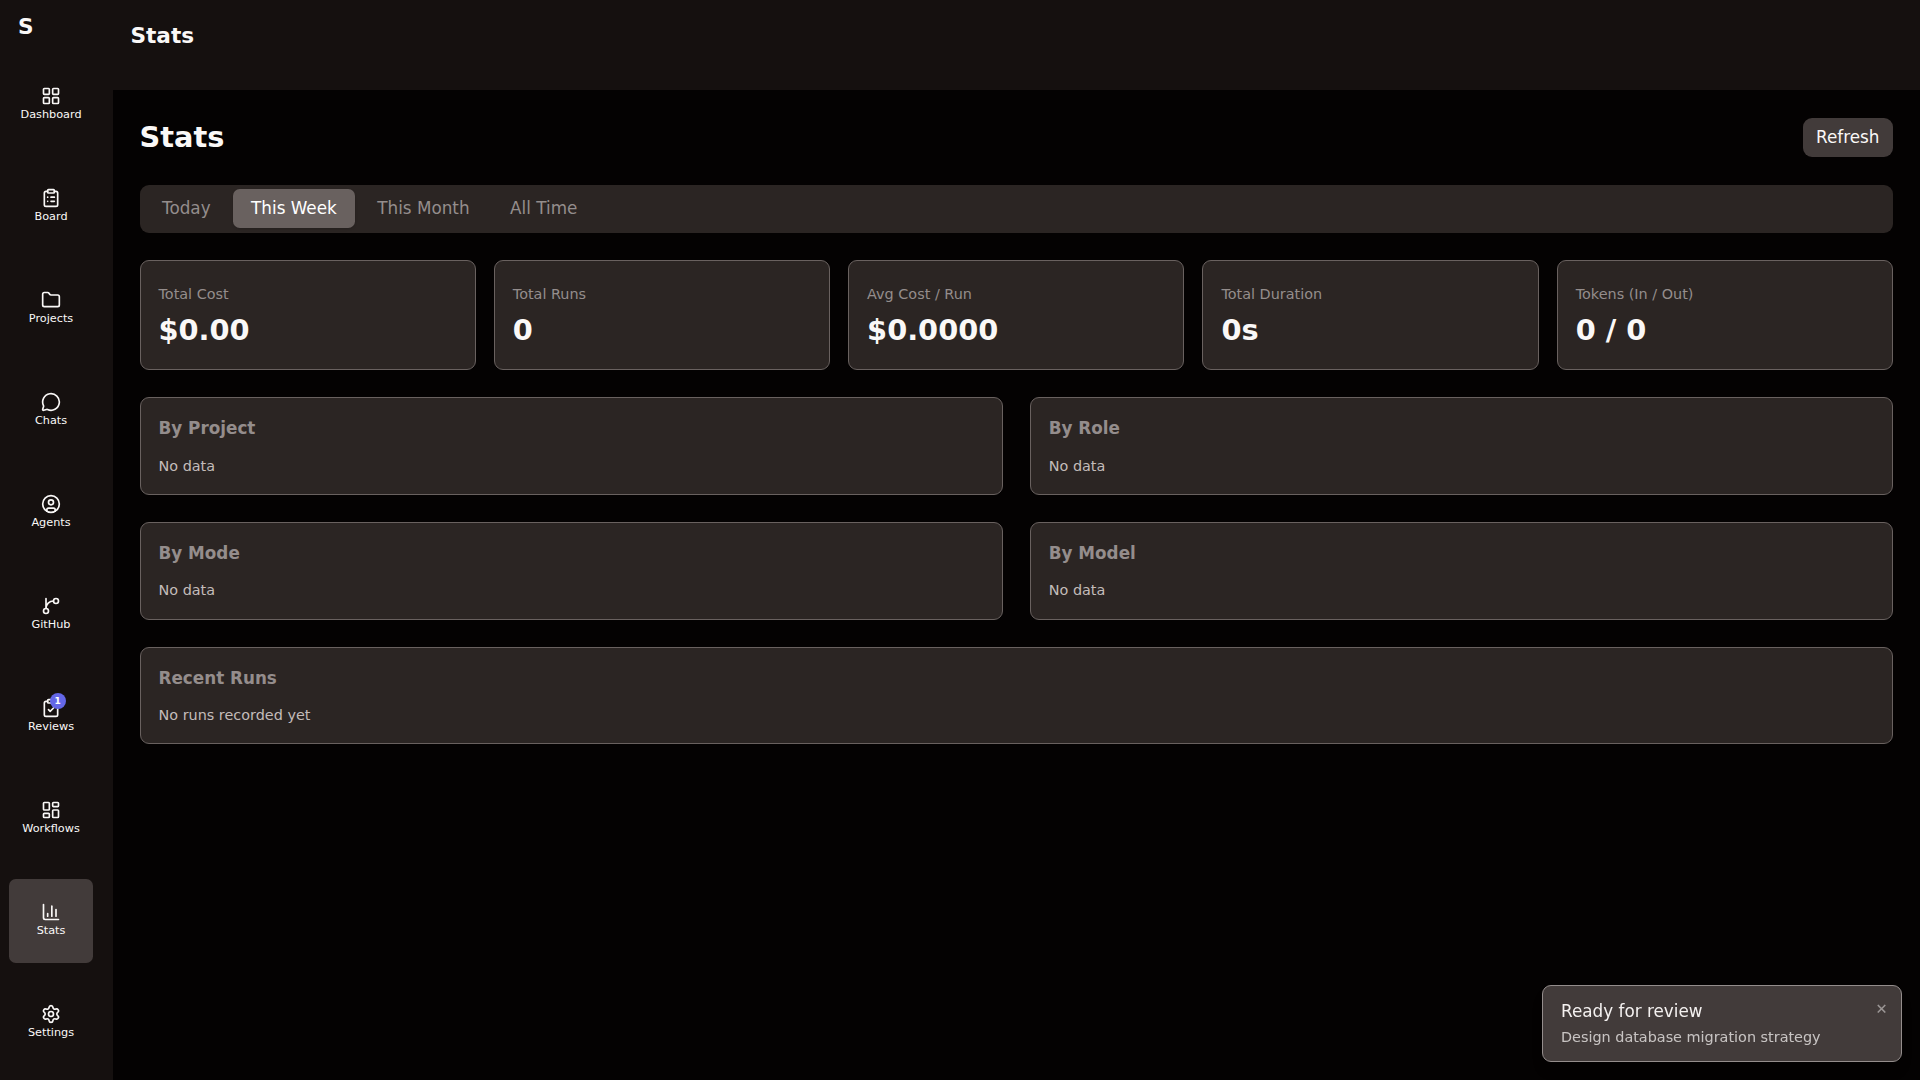
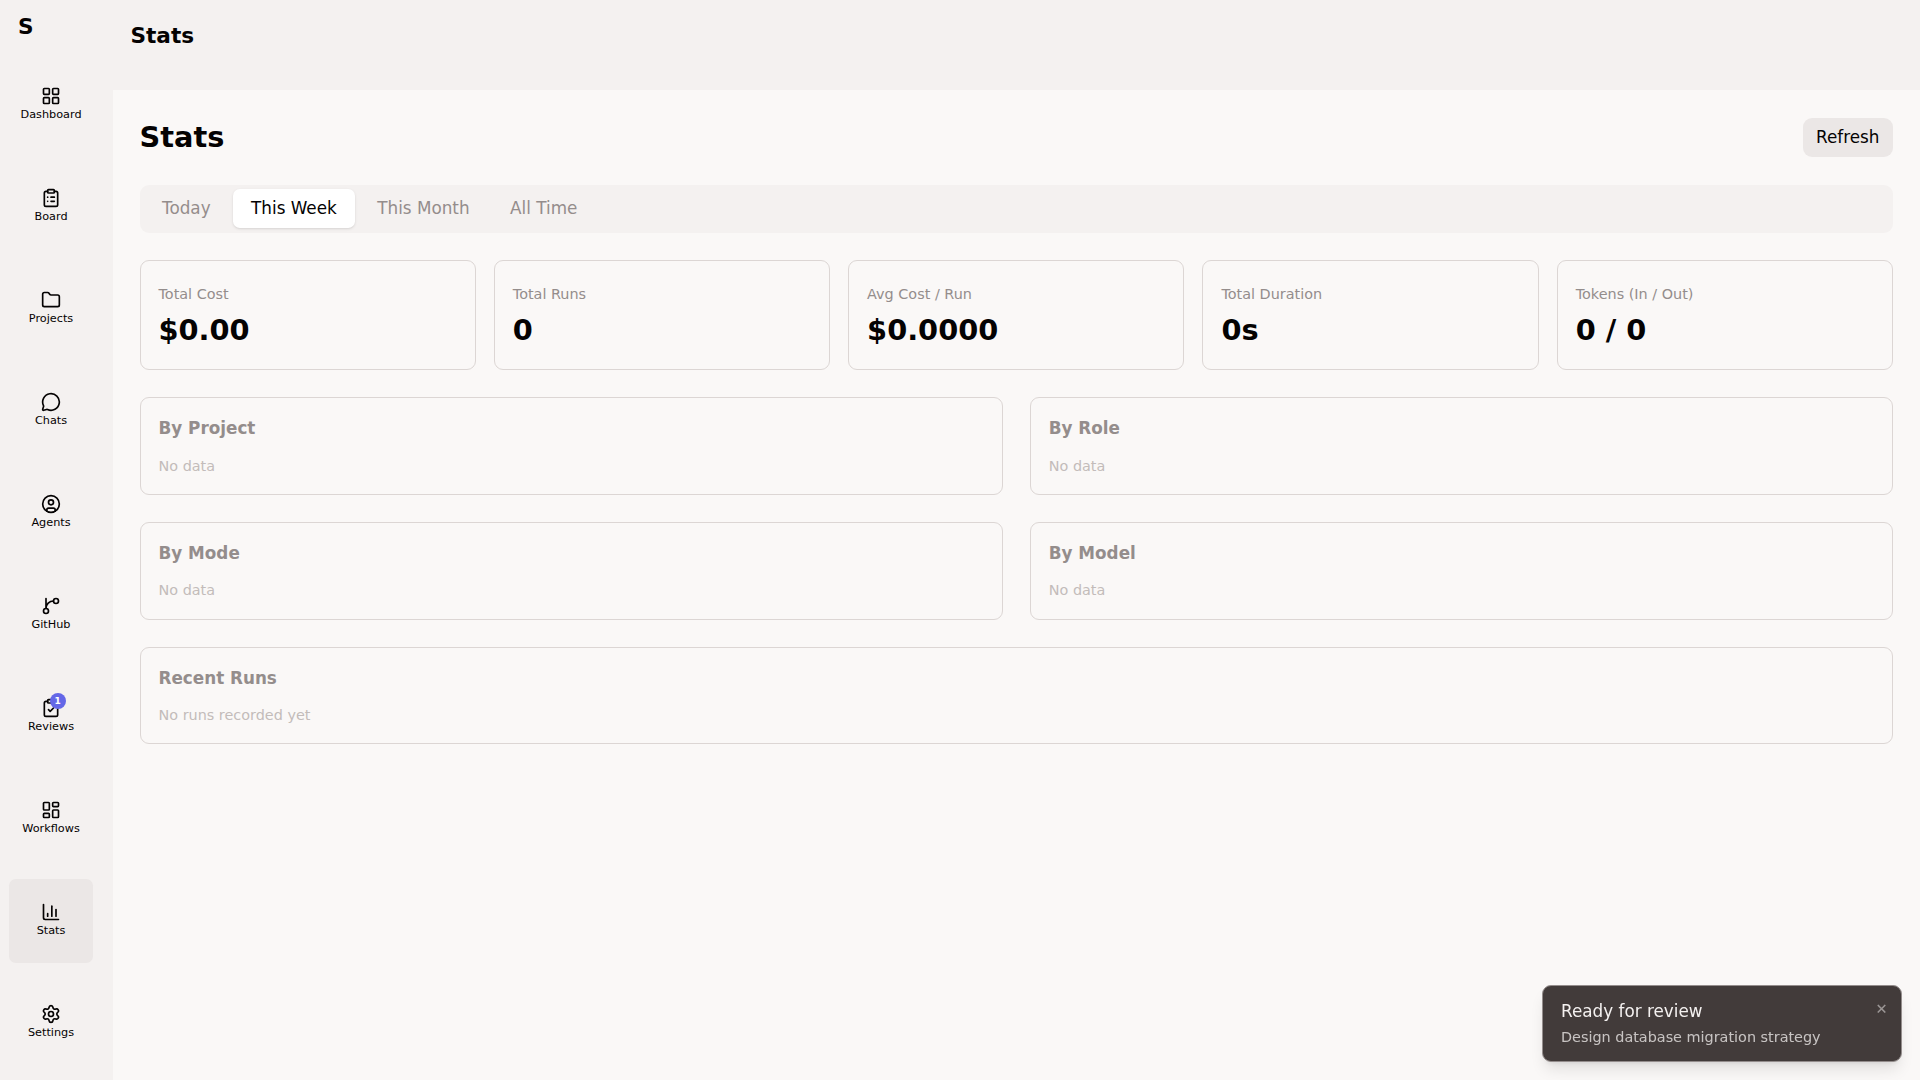
Seven-day window. Use for:
- Weekly cost review (set a budget, watch the trend)
- Throughput tracking (tasks completed per day)
- Regression detection (fail rate going up over time)
Per-project
Section titled “Per-project”Toggle the project dropdown. Stats filter to one project:
- Hours of agent time
- Cost
- Pass rate
- Mean time in each status
Useful when one project is dominating your budget.
Cost attribution
Section titled “Cost attribution”Every result event from a headless agent includes cost and tokens. Sybra sums these into:
- Per agent run (
agent_runs[].cost_usdon each task) - Per task (rollup of all runs)
- Per day (
~/.sybra/stats.json) - Per month (rolled over at UTC midnight)
Interactive (tmux) sessions don’t emit result events. Their cost is unknown. If you use interactive mode heavily, stats understate your real spend.
Set a monthly budget
Section titled “Set a monthly budget”In ~/.sybra/config.yaml:
agent: max_cost_usd: 5.0 # per-run ceilingNo global monthly cap exists — Sybra only enforces per-run. Set per-run low (e.g. $0.50) and let escalations surface when tasks need more.
Export stats
Section titled “Export stats”CLI:
sybra-cli audit --days 7 --json > week.jsonThe audit log is append-only NDJSON at ~/.sybra/logs/audit/YYYY-MM-DD.ndjson. One entry per agent run and task change.
Read the raw audit log
Section titled “Read the raw audit log”tail -f ~/.sybra/logs/audit/$(date -u +%Y-%m-%d).ndjson | jq .Events include type, task_id, agent_id, cost_delta, tokens, message.
Respond to anomalies
Section titled “Respond to anomalies”When a task’s cost exceeds p95 of similar tasks, the self-monitor flags it. You’ll see it on Dashboard’s “Recent agent runs” with an outlier badge. Click through to see:
- Why it was flagged (cost, turns, repeated failures)
- The run transcript
- Suggested corrective action (tighten prompt, lower max_turns, etc.)
Acting on these is how the swarm gets cheaper over time.